4.2.4 Collective Filter Transmission Profiles
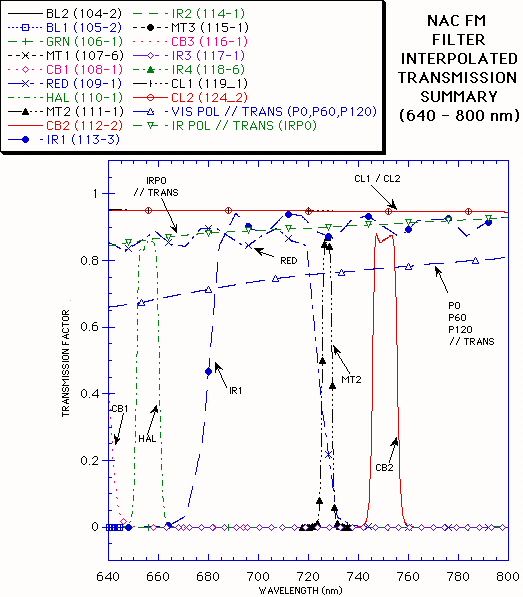
The filter transmission data was interpolated over the spectral range of the data in order to plot all filter transmission data simultaneously (at 0.1 nm intervals). The graphs which follow are divided into overlapping spectral ranges to show the collective spectral transmission profiles of the filters.
4.2.4.1 NAC FM Filter Data
BL1, CL1, CL2, P0, P60, P120, UV1,UV2, UV3 BL1, BL2, CB1, CL1, CL2, GRN, P0, P60, P120, RED, UV3
CB1, CL1,CL2, IRP0, MT1, GRN, P0, P60, P120, RED CB1, CB2, CL1, CL2, HAL, IR1, IRP0, MT2, P0, P60, P120,
RED CB3, CL1,CL2, IR1, IR2, IR3, IRP0, MT3 CB3, CL1,CL2, IR1, IR2, IR3, IR4, IRP0, MT3
4.2.4.2 WAC FM Filter Data
BL1, CL1, CL2, GRN, RED, VIO BL1, CB2, CL1, CL2, GRN, HAL, IR1, IRP0, IRP90, MT2, RED,
VIO CB2, CL1,CL2, IR1, IRP0, IRP90, MT2, RED CB2, CB3, CL1, CL2, IR1, IR2, IR3, IR4, IR5, IRP0, IRP90,
MT2, MT3, RED CB3, CL1, CL2, IR1, IR2, IR3, IR4, IR5, IRP0, IRP90,
MT3 BL1,CB2, CB3, CL1, CL2 ,GRN, HAL, IR1, IR2, IR3, IR4,
IR5, IRP0, IRP90, MT2, MT3, RED, VIO