|
Spitzer Sees Water Loud and Clear
- Click the image above for a larger view
- Full-Res JPEG (3000 x 2400) (987.8 kB)
- Full-Res TIFF (3000 x 2400) (21.6 MB)
Caption:
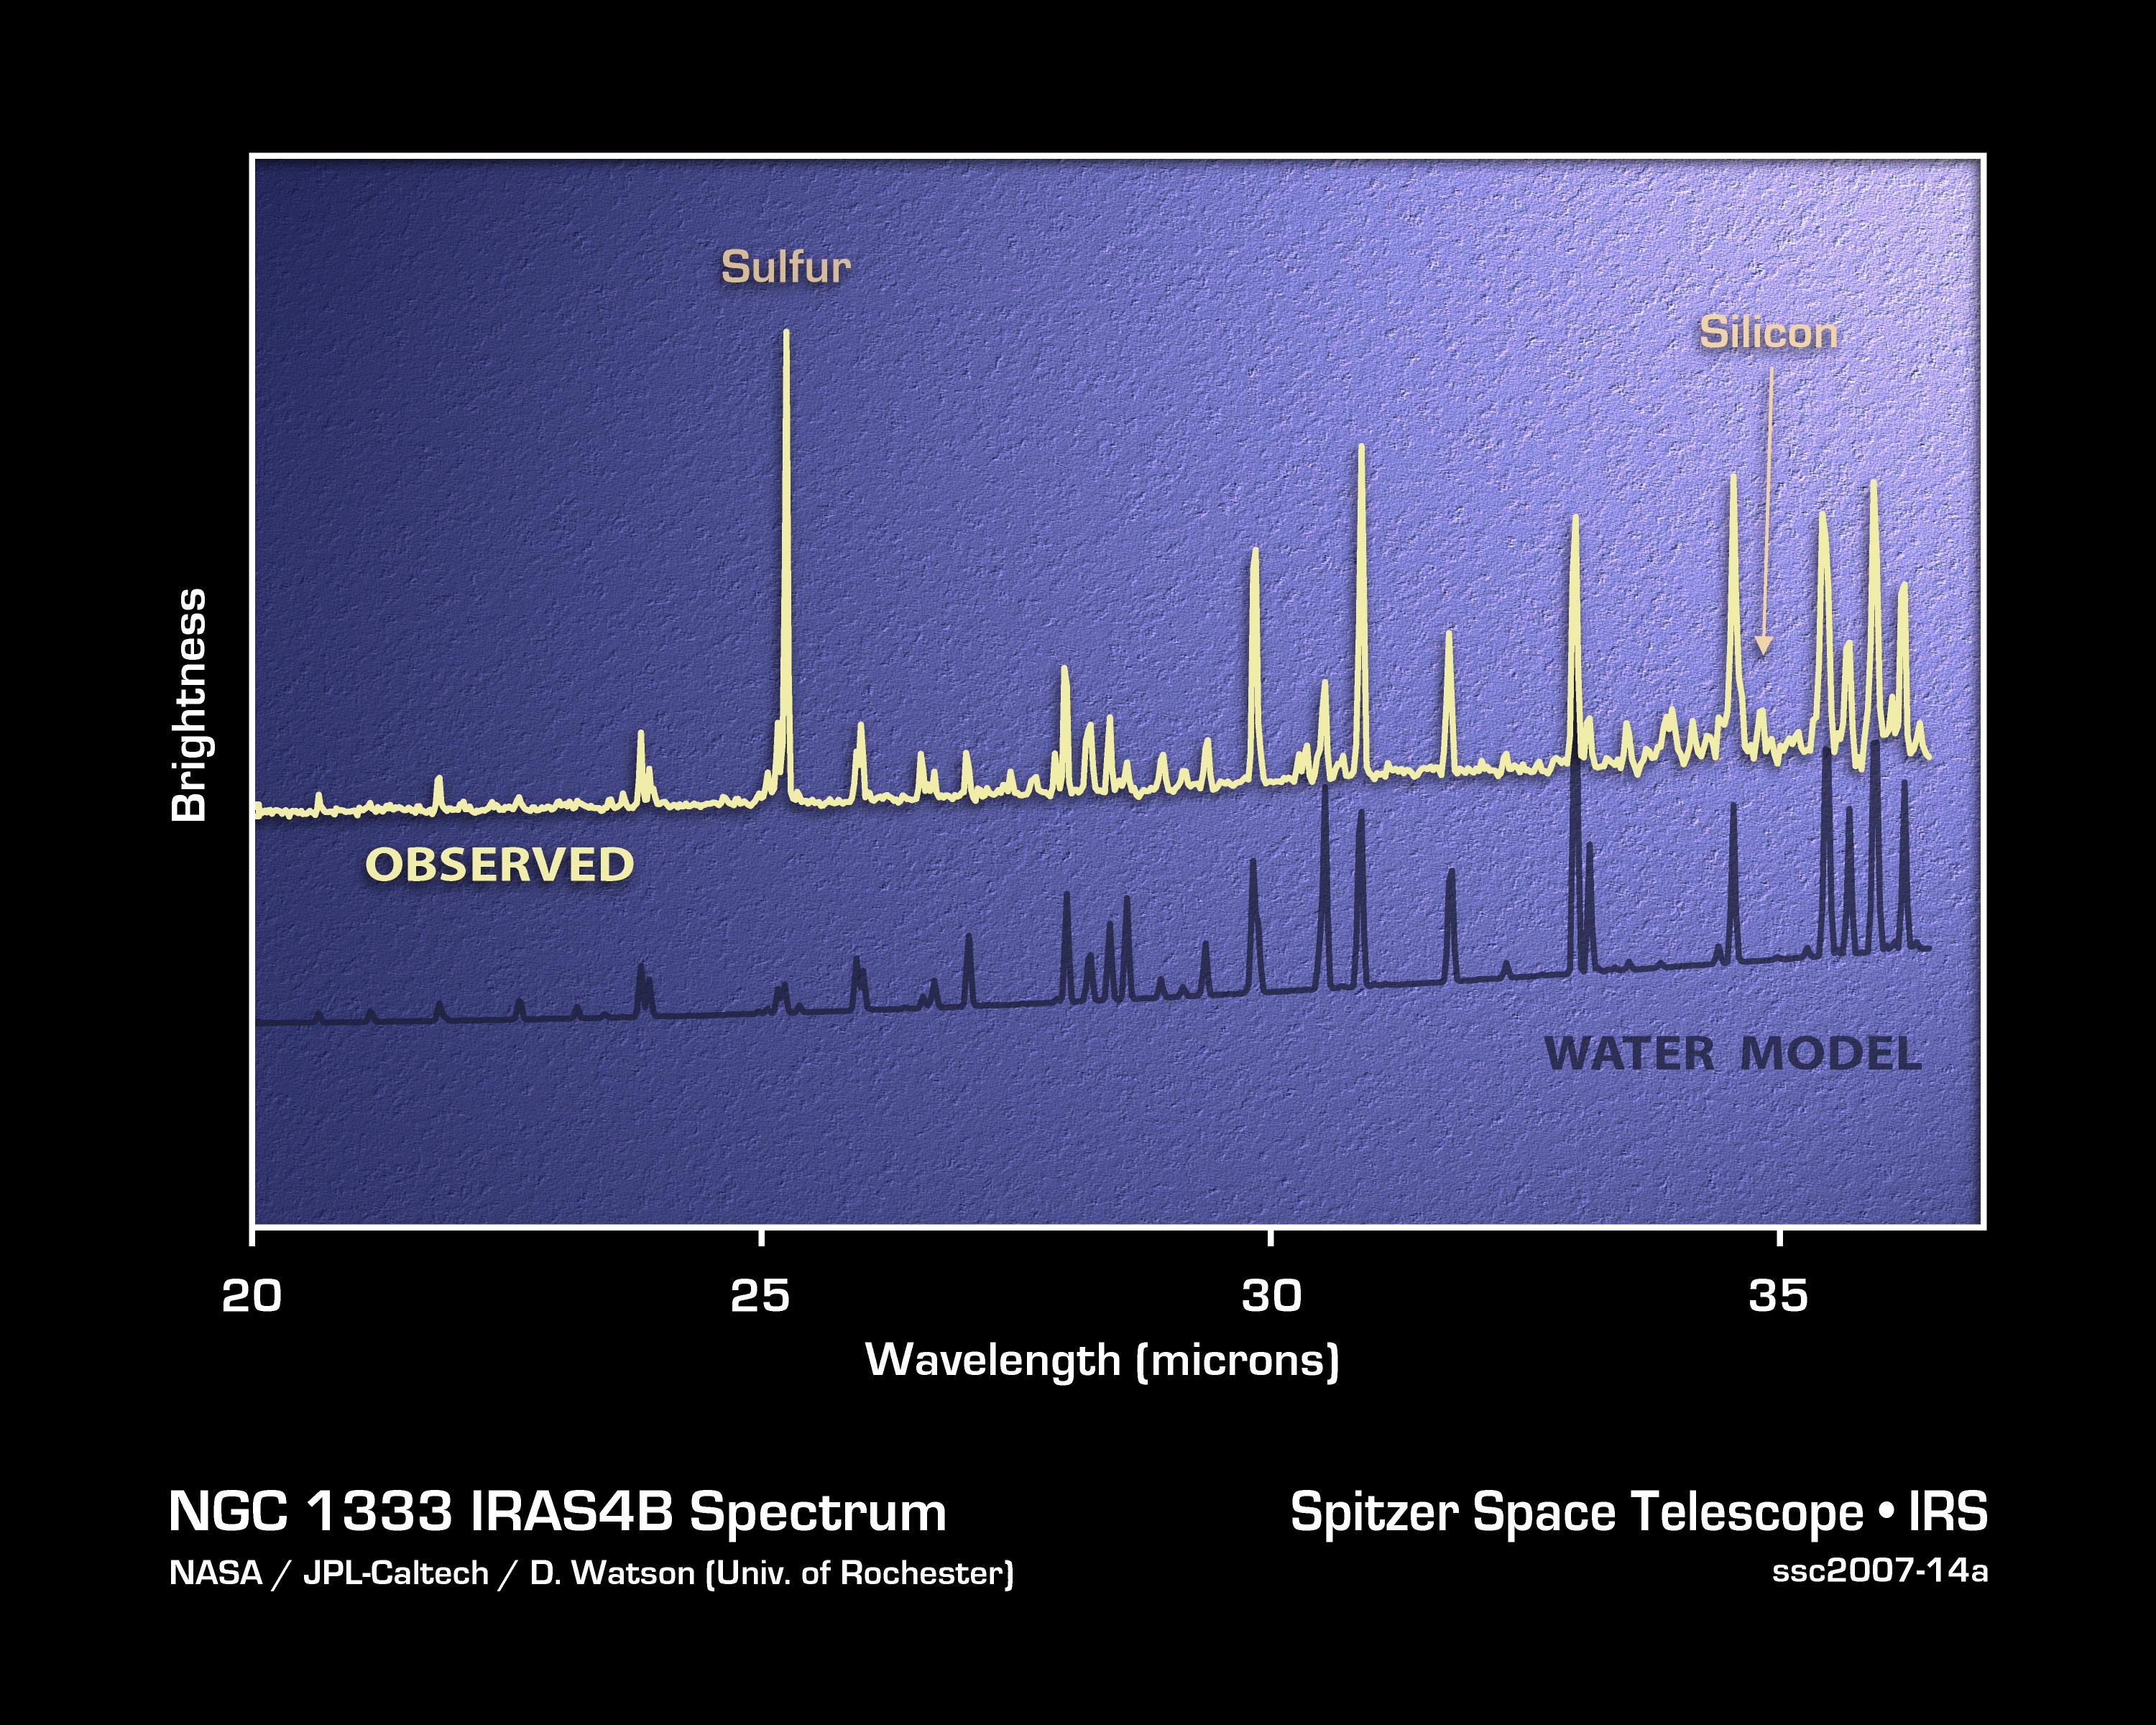
This plot of infrared data, called a spectrum, shows the strong signature of water vapor deep within the core of an embryonic star system, called NGC 1333-IRAS 4B.
The data were captured by NASA's Spitzer Space Telescope using an instrument called a spectrograph. A spectrograph collects light and sorts it according to color, or wavelength. In this case, infrared light from NGC 1333-IRAS 4B was broken up into the wavelengths listed on the horizontal axis of the plot. The sharp spikes, called spectral lines, occur at wavelengths at which the stellar object is particularly bright. The signature of water vapor is revealed in the pattern of wavelengths at which the spikes appear.
By comparing the observed data to a model (lower curve), astronomers can also determine the physical and chemical details of the region. For example, astronomers say these data suggest that ice in a cocoon surrounding the forming star is falling inward. The ice then smacks supersonically into a dusty planet-forming disk surrounding the stellar embryo, heats up and vaporizes quickly, releasing the infrared light that Spitzer collected.
Cataloging Keywords:
| Name | Value | Additional Values |
|---|---|---|
| Target | NGC 1333 | |
| System | ||
| Target Type | Exoplanet | |
| Mission | Spitzer Space Telescope | |
| Instrument Host | Spitzer Space Telescope | |
| Host Type | Space Telescope | |
| Instrument | Infrared Spectrograph (IRS) | |
| Detector | ||
| Extra Keywords | Color, Disk, Dust, Infrared, Water | |
| Acquisition Date | ||
| Release Date | 2007-08-29 | |
| Date in Caption | ||
| Image Credit | NASA/JPL-Caltech/Univ. of Roch. | |
| Source | photojournal.jpl.nasa.gov/catalog/PIA09965 | |
| Identifier | PIA09965 | |
