skip to navigation

|
How to Find Water on the Moon
- Click the image above for a larger view
- Full-Res JPEG (910 x 521) (67.3 kB)
- Full-Res TIFF (910 x 521) (1.4 MB)
Caption:
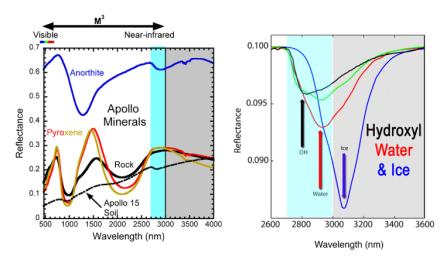
These graphs show detailed measurements of light as a function of color or wavelength. The data, called spectra, are used to identify minerals and molecules. On the left are spectra of lunar rocks, minerals and soil returned to Earth by NASA's Apollo missions, taken in the visible to shorter wavelength infrared range. The blue bar shows where a dip in the light is expected due to the presence of water and hydroxyl molecules. To the right are model spectra for pure water (H2O) and hydroxyl (OH-).
Cataloging Keywords:
| Name | Value | Additional Values |
|---|---|---|
| Target | Moon | |
| System | Earth | |
| Target Type | Satellite | |
| Mission | ||
| Instrument Host | ||
| Host Type | ||
| Instrument | ||
| Detector | ||
| Extra Keywords | Color, Infrared, Water | |
| Acquisition Date | ||
| Release Date | 2009-09-24 | |
| Date in Caption | ||
| Image Credit | ISRO/NASA/JPL-Caltech/Brown Univ. | |
| Source | photojournal.jpl.nasa.gov/catalog/PIA12236 | |
| Identifier | PIA12236 | |
