
|
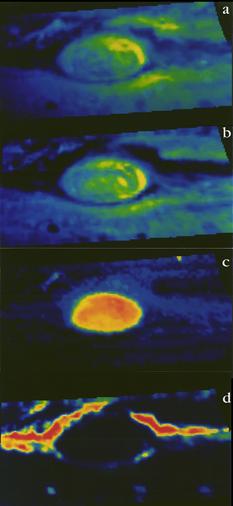
NIMS Spectral Maps of Jupiter’s Great Red Spot
- Click the image above for a larger view
- Full-Res JPEG (233 x 506) (14.4 kB)
- Full-Res TIFF (233 x 506) (261.8 kB)
Caption:
The Near-Infrared Mapping Spectrometer (NIMS) instrument looks at Jupiter's Great Red Spot, in these views from June 26, 1996. NIMS studies infrared wavelengths of light that our eye cannot see. These maps are at four different infrared wavelengths, each one picked to reveal something different about the atmosphere.
The top image is a false color map of a wavelength that is at the red edge of our ability to see. It shows the shapes of features that we would see with our eyes.
The second map is of ammonia ice, red showing where the most ice is, blue where none exists. The differences between this and the first image are due to the amount and size of ammonia ice crystals.
The third map down is from a wavelength that shows cloud heights, with the highest clouds in red, and the lowest in blue.
The bottom map uses a wavelength that shows the hot Jupiter shining through the clouds. Red represents the thinnest clouds, and blue is thickest where it is more difficult to see below. Comparing the bottom two images, note that the highest clouds are in the center of the Great Red Spot, while there are relatively few clouds around the edges.
Background Info:
The Jet Propulsion Laboratory, Pasadena, CA manages the mission for NASA's Office of Space Science, Washington, DC.
This image and other images and data received from Galileo are posted on the World Wide Web, on the Galileo mission home page at http://galileo.jpl.nasa.gov.
Cataloging Keywords:
| Name | Value | Additional Values |
|---|---|---|
| Target | Jupiter | |
| System | Jupiter | |
| Target Type | Planet | Exoplanet |
| Mission | Galileo | |
| Instrument Host | Galileo Orbiter | |
| Host Type | Orbiter | |
| Instrument | Near-Infrared Mapping Spectrometer (NIMS) | |
| Detector | ||
| Extra Keywords | Ammonia, Atmosphere, Color, Infrared, Map, Storm | |
| Acquisition Date | ||
| Release Date | 1998-03-26 | |
| Date in Caption | 1996-06-26 | |
| Image Credit | NASA/JPL | |
| Source | photojournal.jpl.nasa.gov/catalog/PIA00501 | |
| Identifier | PIA00501 | |