|
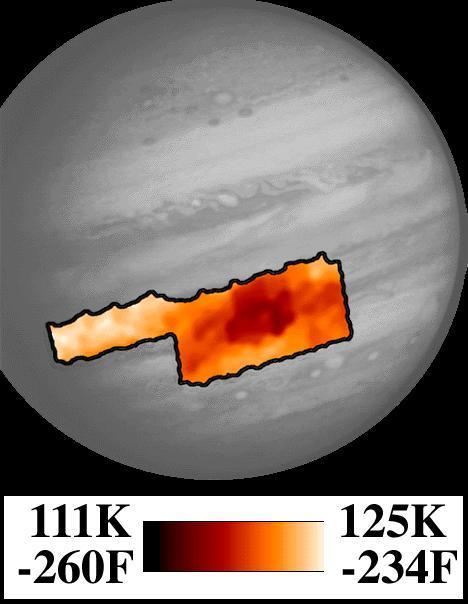
Photopolarimeter/Radiometer (PPR) Temperature Map of Great Red Spot
- Click the image above for a larger view
- Full-Res JPEG (468 x 604) (32.6 kB)
- Full-Res TIFF (468 x 604) (340.9 kB)
Caption:
This map shows temperatures for the region around Jupiter's Great Red Spot and an area to the northwest. The center of the Great Red Spot appears colder than the surrounding areas, and actually is colder than any other place in Jupiter's atmosphere. The center of the spot is a region where winds bring gases up from underneath. The ammonia in the rising air condenses as it comes up and so forms tall thick clouds, much the same way as rising air in the Earth's atmosphere over moist areas forms high water clouds. It is a little warmer to the immediate east and west of the spot, where the uprising winds are weaker. To the south is a warm area where winds are generally descending and clearer of clouds. The northwestern area in this map shows atmosphere that is much warmer and drier, and the gases there are descending, so it is much clearer of clouds. This map corresponds to a level in Jupiter's atmosphere where the pressure is only 1/4 of the Earth's at sea level (250 millibars), the same as it is near 1200 meters (40,000 feet) above sea level in the Earth. This map was made from data taken by the Photopolarimeter/Radiometer (PPR) instrument on June 26, 1996.
Background Info:
JPL manages the Galileo mission for NASA's Office of Space Science, Washington, D.C.
This image and other images and data received from Galileo are posted on the World Wide Web, on the Galileo mission home page at URL http://galileo.jpl.nasa.gov.
Cataloging Keywords:
| Name | Value | Additional Values |
|---|---|---|
| Target | Jupiter | |
| System | Jupiter | |
| Target Type | Planet | |
| Mission | Galileo | |
| Instrument Host | Galileo Orbiter | |
| Host Type | Orbiter | |
| Instrument | Photopolarimeter-Radiometer (PPR) | |
| Detector | ||
| Extra Keywords | Ammonia, Atmosphere, Color, Map, Storm, Water | |
| Acquisition Date | ||
| Release Date | 1998-04-02 | |
| Date in Caption | 1996-06-26 | |
| Image Credit | NASA/JPL | |
| Source | photojournal.jpl.nasa.gov/catalog/PIA01233 | |
| Identifier | PIA01233 | |