
|
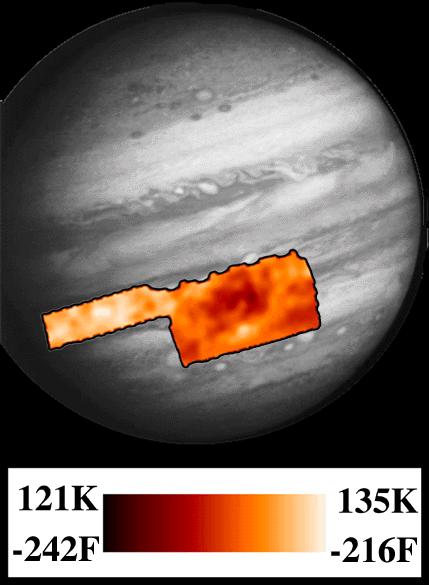
PPR Great Red Spot Temperature Map
- Click the image above for a larger view
- Full-Res JPEG (429 x 585) (30.7 kB)
- Full-Res TIFF (429 x 585) (65.5 kB)
Caption:
This map shows temperature for the region around Jupiter's Great Red Spot and an area to the northwest. It corresponds to a level in Jupiter's atmosphere where the pressure is 1/2 of the of the Earth's at sea level (500 millibars), the same as it is near 6000 meters (20,000 feet) above sea level on Earth. The center of Great Red Spot appears colder than the surrounding areas, where air from below is being brought up. The "panhandle" to the northwest is warmer and drier, and the gases there are descending, so it is much clearer of clouds. Compare this map to one released earlier at a higher place in the atmosphere (250 millibars or 12000 meters). The center of the Great Red Spot is warmer lower in the atmosphere, and a white "hot spot" appears in this image that is not present at the higher place. This map was made from data taken by the Photopolarimeter/Radiometer (PPR) instrument on June 26, 1996.
Launched in October 1989, Galileo entered orbit around Jupiter on December 7, 1995. The spacecraft's mission is to conduct detailed studies of the giant planet, its largest moons and the Jovian magnetic environment.
Background Info:
JPL manages the Galileo mission for NASA's Office of Space Science, Washington, D.C.
This image and other images and data received from Galileo are posted on the World Wide Web, on the Galileo mission home page at URL http://galileo.jpl.nasa.gov.
Cataloging Keywords:
| Name | Value | Additional Values |
|---|---|---|
| Target | Jupiter | |
| System | Jupiter | |
| Target Type | Planet | |
| Mission | Galileo | |
| Instrument Host | Galileo Orbiter | |
| Host Type | Orbiter | |
| Instrument | Photopolarimeter-Radiometer (PPR) | |
| Detector | ||
| Extra Keywords | Atmosphere, Color, Magnetosphere, Map, Storm | |
| Acquisition Date | ||
| Release Date | 1998-04-02 | |
| Date in Caption | 1995-12-07 | 1996-06-26 |
| Image Credit | NASA/JPL | |
| Source | photojournal.jpl.nasa.gov/catalog/PIA01234 | |
| Identifier | PIA01234 | |