
|
Water Abundance Dependent on Temperature
- Click the image above for a larger view
- Full-Res JPEG (1000 x 750) (61.5 kB)
- Full-Res TIFF (1000 x 750) (2.3 MB)
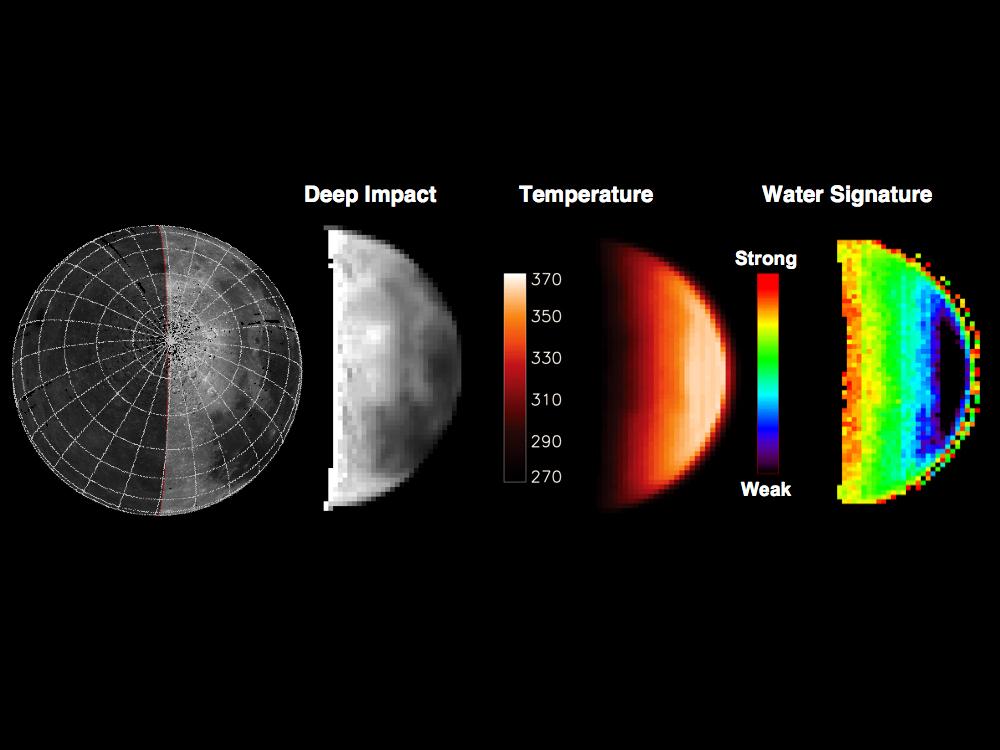
Caption:
This chart highlights observations from NASA's Deep Impact mission of the northern polar regions of the moon acquired on June 9, 2009. The image at left is a map of the moon taken by the U.S. Clementine satellite -- the rest of the images are different representations of Deep Impact data, including measurements of brightness, temperature, and strength of a signature for water and hydroxyl molecules. The water signature varies significantly across the lunar surface; the strength of the signature is not correlated with terrain type but is highly dependent on temperature.
Since successfully carrying out its spectacular impact experiment at comet Tempel 1 on July 4, 2005, the Deep Impact spacecraft has been on an extended mission, called Epoxi, which culminates in a flyby of comet Hartley 2 on November 4, 2010. The spacecraft observed the moon for calibration purposes on several occasions en route to the second comet.
Cataloging Keywords:
| Name | Value | Additional Values |
|---|---|---|
| Target | Moon | 103P/Hartley, 9P/Tempel |
| System | Earth | Periodic Comets |
| Target Type | Satellite | Comet |
| Mission | Deep Impact | |
| Instrument Host | Deep Impact | |
| Host Type | Impactor | |
| Instrument | ||
| Detector | ||
| Extra Keywords | Color, Impact, Map, Water | |
| Acquisition Date | ||
| Release Date | 2009-09-24 | |
| Date in Caption | 2005-07-04 | 2009-06-09, 2010-11-04 |
| Image Credit | NASA/JPL-Caltech/University of Maryland | |
| Source | photojournal.jpl.nasa.gov/catalog/PIA12223 | |
| Identifier | PIA12223 | |