|
Pressure Cycles on Mars
- Click the image above for a larger view
- Full-Res JPEG (2999 x 2249) (262.7 kB)
- Full-Res TIFF (2999 x 2249) (20.2 MB)
Caption:
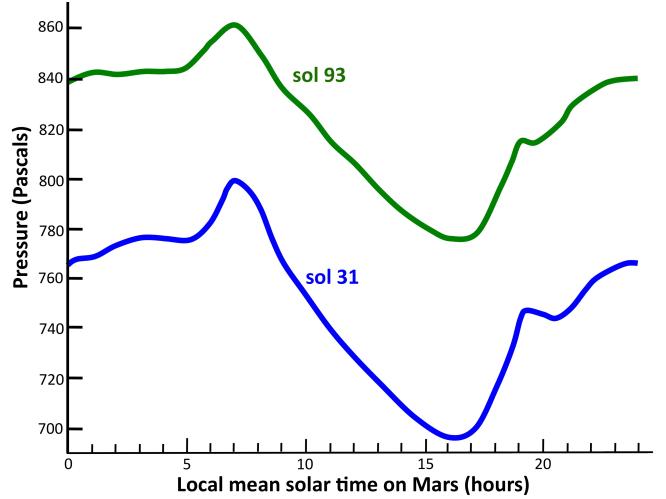
This graph shows the atmospheric pressure at the surface of Mars, as measured by the Rover Environmental Monitoring Station on NASA's Curiosity rover. The blue curve shows data from Sol 31 (Sept. 6, 2012) and the green curve shows data from Sol 93 (Nov. 7, 2012). Pressure is a measure of the amount of air in the whole column of atmosphere sitting above the rover.
The overall increase in pressure between Sol 31 and Sol 93 is the signature of the entire Martian atmosphere growing in mass as we move into springtime in the southern hemisphere. This happens because the south pole receives more and more sunlight, and carbon dioxide vaporizes off of the winter south polar cap. Each year the atmosphere grows and shrinks by about 30 percent due to this effect. The curves also show a strong daily variation in pressure of around 10 percent, with a peak near 7 a.m. on Mars and a minimum near 4 p.m. This daily cycle in pressure is caused by a "thermal tide," a global-scale pressure wave in Mars' atmosphere driven by sunlight heating the ground and air.
Background Info:
NASA's Jet Propulsion Laboratory, a division of the California Institute of Technology, Pasadena, manages the Mars Science Laboratory Project for NASA's Science Mission Directorate, Washington. JPL designed and built the rover.
For more information about Curiosity and its mission, visit: http://www.nasa.gov/msl and http://mars.jpl.nasa.gov/msl .
Cataloging Keywords:
| Name | Value | Additional Values |
|---|---|---|
| Target | Mars | |
| System | ||
| Target Type | Planet | |
| Mission | Mars Science Laboratory (MSL) | |
| Instrument Host | Curiosity Rover | |
| Host Type | Rover | |
| Instrument | Rover Environmental Monitoring Station (REMS) | |
| Detector | ||
| Extra Keywords | Atmosphere, Color, Thermal | |
| Acquisition Date | ||
| Release Date | 2012-11-15 | |
| Date in Caption | 2012-11-07 | |
| Image Credit | NASA/JPL-Caltech/CAB(CSIC-INTA)/FMI/Ashima Research | |
| Source | photojournal.jpl.nasa.gov/catalog/PIA16477 | |
| Identifier | PIA16477 | |