
|
Data Recorded as Juno Entered Magnetosphere
- Click the image above for a larger view
- Full-Res JPEG (1140 x 523) (66.2 kB)
- Full-Res TIFF (1140 x 523) (482.0 kB)
Caption:
Click on the image for the animation
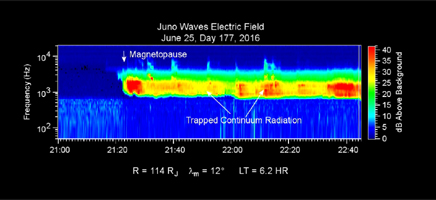
This chart presents data that the Waves investigation on NASA's Juno spacecraft recorded as the spacecraft entered Jupiter's magnetosphere on June 25, 2016, while approaching Jupiter. Audio accompanies the animation, with volume and pitch correlated to the amplitude and frequency of the recorded waves.
Time runs from left to right, with a total elapsed time of one hour and 45 minutes. The label "Magnetopause" at just over 20 minutes into the chart marks entry into the magnetosphere, as detected by the sudden onset of a type of high-amplitude wave activity called "Trapped Continuum Radiation."
The graph uses color coding to indicate wave amplitudes as a function of wave frequency (vertical axis, in hertz) and time (horizontal axis).
The trapped continuum radiation -- in the red and yellow area of this spectrogram -- consists of electromagnetic waves that are trapped in a low-density cavity in Jupiter's outer magnetosphere. The walls of the cavity are like a conductor, hence, the cavity traps these low-frequency waves. The low-frequency limit of these waves -- the lower edge of the band on the graph -- is a function of the density of particles in this outer region of the magnetosphere. The density here is roughly one electron per hundred cubic centimeters (6 cubic inches), about one percent of the density Juno detected in the solar wind just outside of the bow shock.
The vertical bar to the right of the chart indicates the color coding of wave amplitude, in decibels (dB) above the background level detected by the Waves instrument. Each step of 10 decibels marks a tenfold increase in wave power.
When Juno collected these data, the distance from the spacecraft to Jupiter was about 4.95 million miles (7.97 million kilometers), indicated on the chart as 114 times the radius of Jupiter. Jupiter's magnetic field is tilted about 10 degrees from the planet's axis of rotation. The note of 12 degrees on the chart indicates that at the time these data were recorded, the spacecraft was 12 degrees north of the magnetic-field equator. The "LT" notation is local time on Jupiter at the longitude of the planet directly below the spacecraft, with a value of 6.2 indicating approximately dawn.
Background Info:
The University of Iowa, Iowa City, provided Juno's Waves instrument. NASA's Jet Propulsion Laboratory, Pasadena, California. manages the Juno mission for the principal investigator, Scott Bolton, of Southwest Research Institute in San Antonio. The Juno mission is part of the New Frontiers Program managed at NASA's Marshall Space Flight Center in Huntsville, Alabama. Lockheed Martin Space Systems, Denver, built the spacecraft. JPL is a division of Caltech in Pasadena.
Cataloging Keywords:
| Name | Value | Additional Values |
|---|---|---|
| Target | Jupiter | |
| System | Jupiter | |
| Target Type | Planet | |
| Mission | Juno | |
| Instrument Host | Juno | |
| Host Type | Orbiter | |
| Instrument | Waves | |
| Detector | ||
| Extra Keywords | Color, Magnetosphere, Rotation | |
| Acquisition Date | ||
| Release Date | 2016-06-30 | |
| Date in Caption | 2016-06-25 | |
| Image Credit | NASA/JPL-Caltech/SwRI/Univ. of Iowa | |
| Source | photojournal.jpl.nasa.gov/catalog/PIA20754 | |
| Identifier | PIA20754 | |